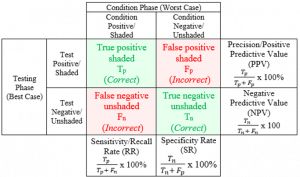
Traditional grid for calculating important diagnostic test result values.


 Research Problem: In medicine, both patients and medical providers have difficulty understanding and interpreting diagnostic test results and how testing accuracy rates apply to them personally. A single diagnostic test result often includes an overwhelming amount of medical statistics. Yet, people perceive numbers as complicated and potentially irrelevant. Mathematical operations are seen as cumbersome. More often than not, though, people simply do not know how to use these numbers in their health decision making.
 Purpose of Research Program: To help doctors and patients understand medical statistics in a way that informs personal medical and health decision making. More importantly, this research was dedicated to helping patients and doctors become informed decision makers within their shared health maintenance and treatment plans.
 Approach: I created a research program using mixed methods to address different pieces of the overall problem. Each step was designed to address an individual section of the multidimensional problem, with results incorporated into the subsequent phases of the research. Triangulation of all these data points led to a cohesive solution which was implemented in medical training programs across the US.
 Solution: Modify presentation of diagnostic test information to focus specifically on the the patient’s and provider’s information request. Provide additional context using progressive reveal as each piece of information becomes understood and incorporated into the decision making process.
Traditional grid for calculating important diagnostic test result values.
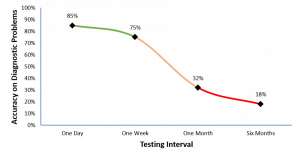
As documented in numerous studies across domains, learning retention drops off significantly after consistent exposure to material is removed.

A brief tutorial increased accuracy almost as much as a full semester of learning how to calculate diagnostic statistics.
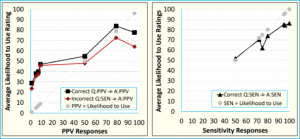
Likelihood to use the test was highly correlated with the evaluated diagnostic value. Tests with lower diagnostic values are less likely to be used and vice versa.
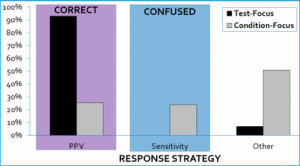
Matching the diagnostic information between the question and response needed increased accuracy to over 90% across 8 unique problems. Participants easily identified the correct value and were less likely to confuse related diagnostic values when information matched expectations.

Computation is more than just mathematical manipulation of values, but instead involves many steps to determine the correct response.